Top 6 Infographic Tools
A good presentation is key for gaining more attention and interest in your content. Whether on your own company website, your personal blog, on social networks or during a pitch meeting at work, you should make it more interesting than just blocks of texts. By creating infographics yourself and enriching your content, you aren’t just upgrading your offering, but also making it easier for your viewers to better understand the context. In order to show colleagues, customers, and online users your own concepts, results, or offers in the best way possible, you should focus on providing information in image form. Infographics are popular among users, mainly for the following reasons:
- Visual information can usually be processed faster than longer text passages.
- Images support text content by emphasizing important information.
- Graphics can easily be shared on social networks.
- Images are a welcoming change from monotonous blocks of text.
- Informative graphics are an important element in online marketing (as an upgrade for SEO content on landing pages, blogs, or social media platforms).
Infographics are therefore not only useful for providing information quickly for the readers, but they also help when it comes to search engine optimization of your web content. The right infographic can achieve a lot by increasing clicks, likes, shares, and conversions for your online presence. By creating infographics yourself, you can determine which pieces of content you want to emphasize and how you want to focus on them thematically.
Programs for creating infographics
There are many different types of software available on the market that you can use to create your own infographics. To give you an idea of those on offer, we present six programs whose basic features are free. In addition, we explain the advantages and disadvantages of each of the tools, the free features as well as the fee-based features included in the premium versions.
Infogr.am: create infographics and visualize data easily
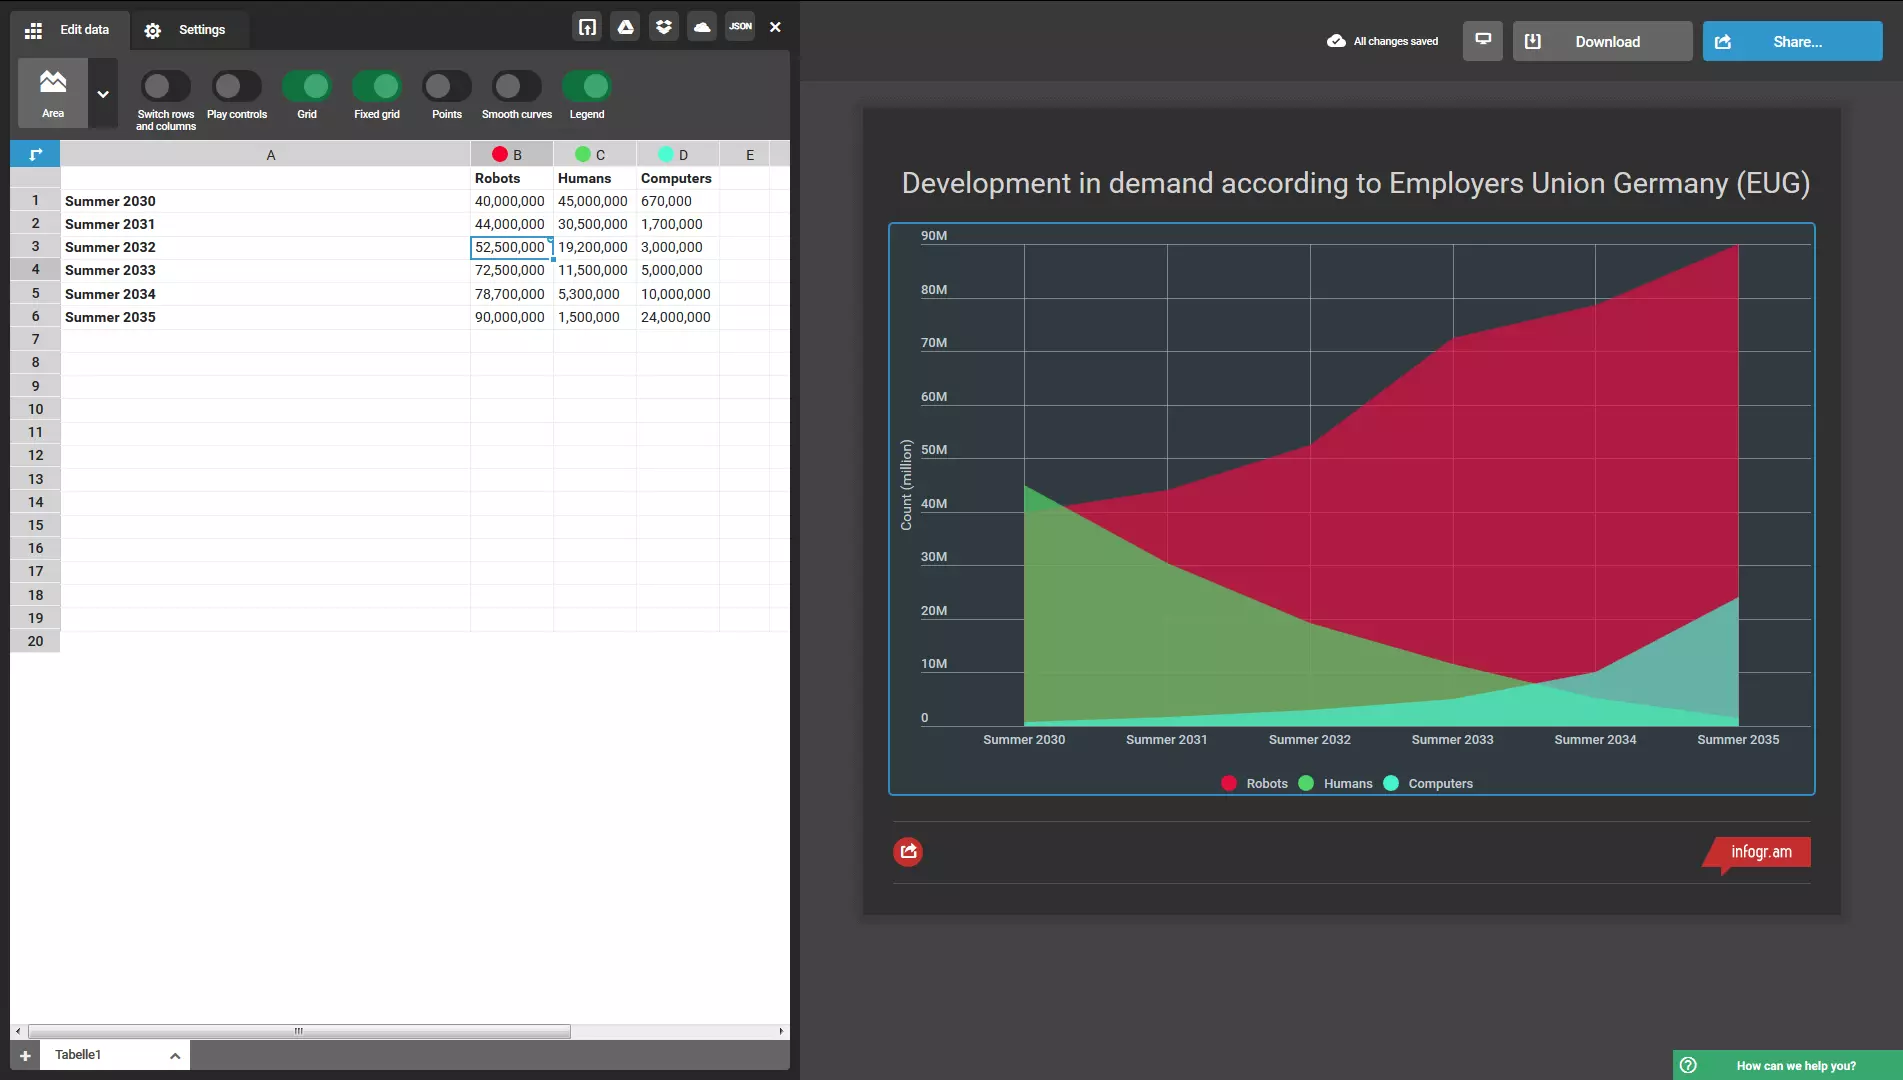
With the free infographics tool, infogr.am, even inexperienced users can very easily create an infographic online without any additional software. Infogr.am is especially simple and practical for beginners: after registering for free, you will get access to the clear user interface with its easy-to-use menu. Using the sidebar, the user can either create their own infographic from scratch, or choose from suitable templates. Afterwards, you can directly add content such as texts, charts (pie, bars, pictograms, etc.), maps, images, or videos. Infogr.am offers a variety of free templates for clear visualizations. The templates and settings on infogr.am are simple to use. Data sets are processed in a similar way to other spreadsheet programs like Excel. If you have a ready-made table at your disposal, you can easily convert it into common table formats such as .xls, .xlsx., and .csv with Google Drive, Dropbox, OneDrive, or via URL as a JSON Feed (JavaScript Object Notation). The sidebar in the editor enables you to use the drag & drop feature to insert image elements (charts, maps, texts, images, videos, and other data sets) and delete them just as easily. If you make an infographic with infogr.am, you can share it with other users by embedding it on your own website. The finished infographics cannot be downloaded, but are published online on the infogr.am site and can be linked to. Premium features, such as verification and monitoring through analysis features (performance measurement according to location and recommendation), exporting as PDF or PNG, extensive maps, unlimited icons, more data volume, linking cell data, comparing tables, team access, and offline sharing, are only available in the monthly subscription package under the pro, business, or enterprise tariff. Verdict: the free tool, infogr.am lets you create intuitive infographics in just a few clicks. Regarding the design possibilities, it is not as diverse as other tools, but if you want to create infographics quickly and easily from just a few values, and publish them online, this service is just right for you.
Easel.ly: create attractive infographics
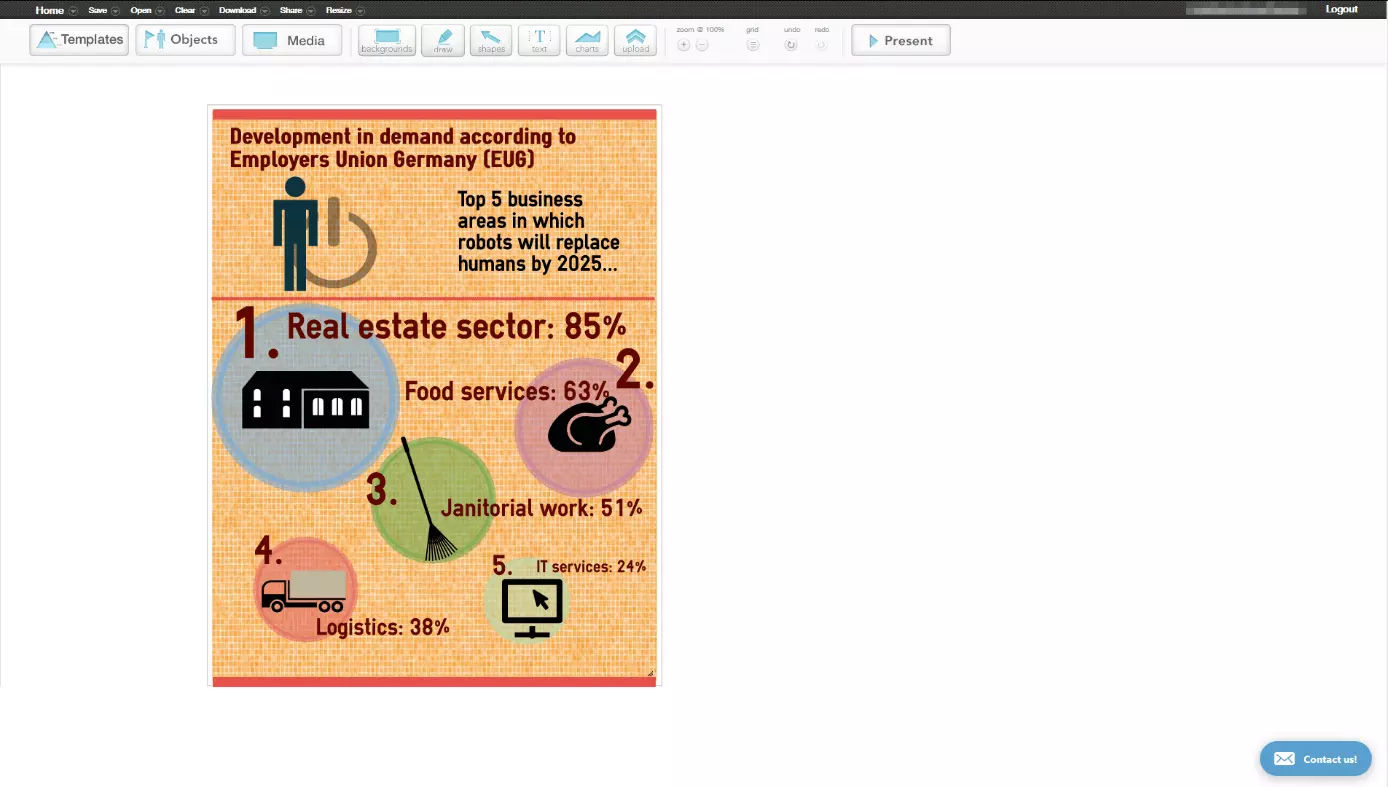
With the infographic tool, easel.ly, you can build visually appealing infographics on a range of topics – simple and free of charge. The design templates, objects, and icons contained in the free basic version enable you to be creative with your design. It’s also possible to integrate a reduced, clear menu bar, templates, icons, images, and videos into your own graphic. You can use the drag & drop feature to add elements to the graphic as well as for selecting the appropriate background. With an additional share button, you can embed your own infographics by code on web pages, send the link in an e-mail, share with others, or work together on it. This means easel.ly is ideal for distributing infographics – via social media networks (Facebook, Twitter), URLs, or embedded code. What easel.ly doesn’t offer is the option to import CSV files from spreadsheet programs – if you have many values, you have to add them manually, which can be quite time-consuming and pointless if you have data-intensive graphics. In addition, the choice of templates is quite limited in the free version of easel.ly. With the fee-based pro account, it’s possible to create thematic infographics (e.g. for business and technology sectors) from 680,000 diverse icons. In addition, you can also use customer support, additional fonts, various upload options (custom fonts and graphics) as well as additional privacy settings. Downloading high resolution PDFs are also only possible in the paid version. However, the infographics you can create for free with easel.ly are enough to leave a good impression on friends, colleagues, and on the internet. Verdict: if you are looking for a user-friendly infographic tool that doesn’t neglect design features, you will be more than happy with easel.ly’s online tool.
Venngage – create attractive infographics with data sets
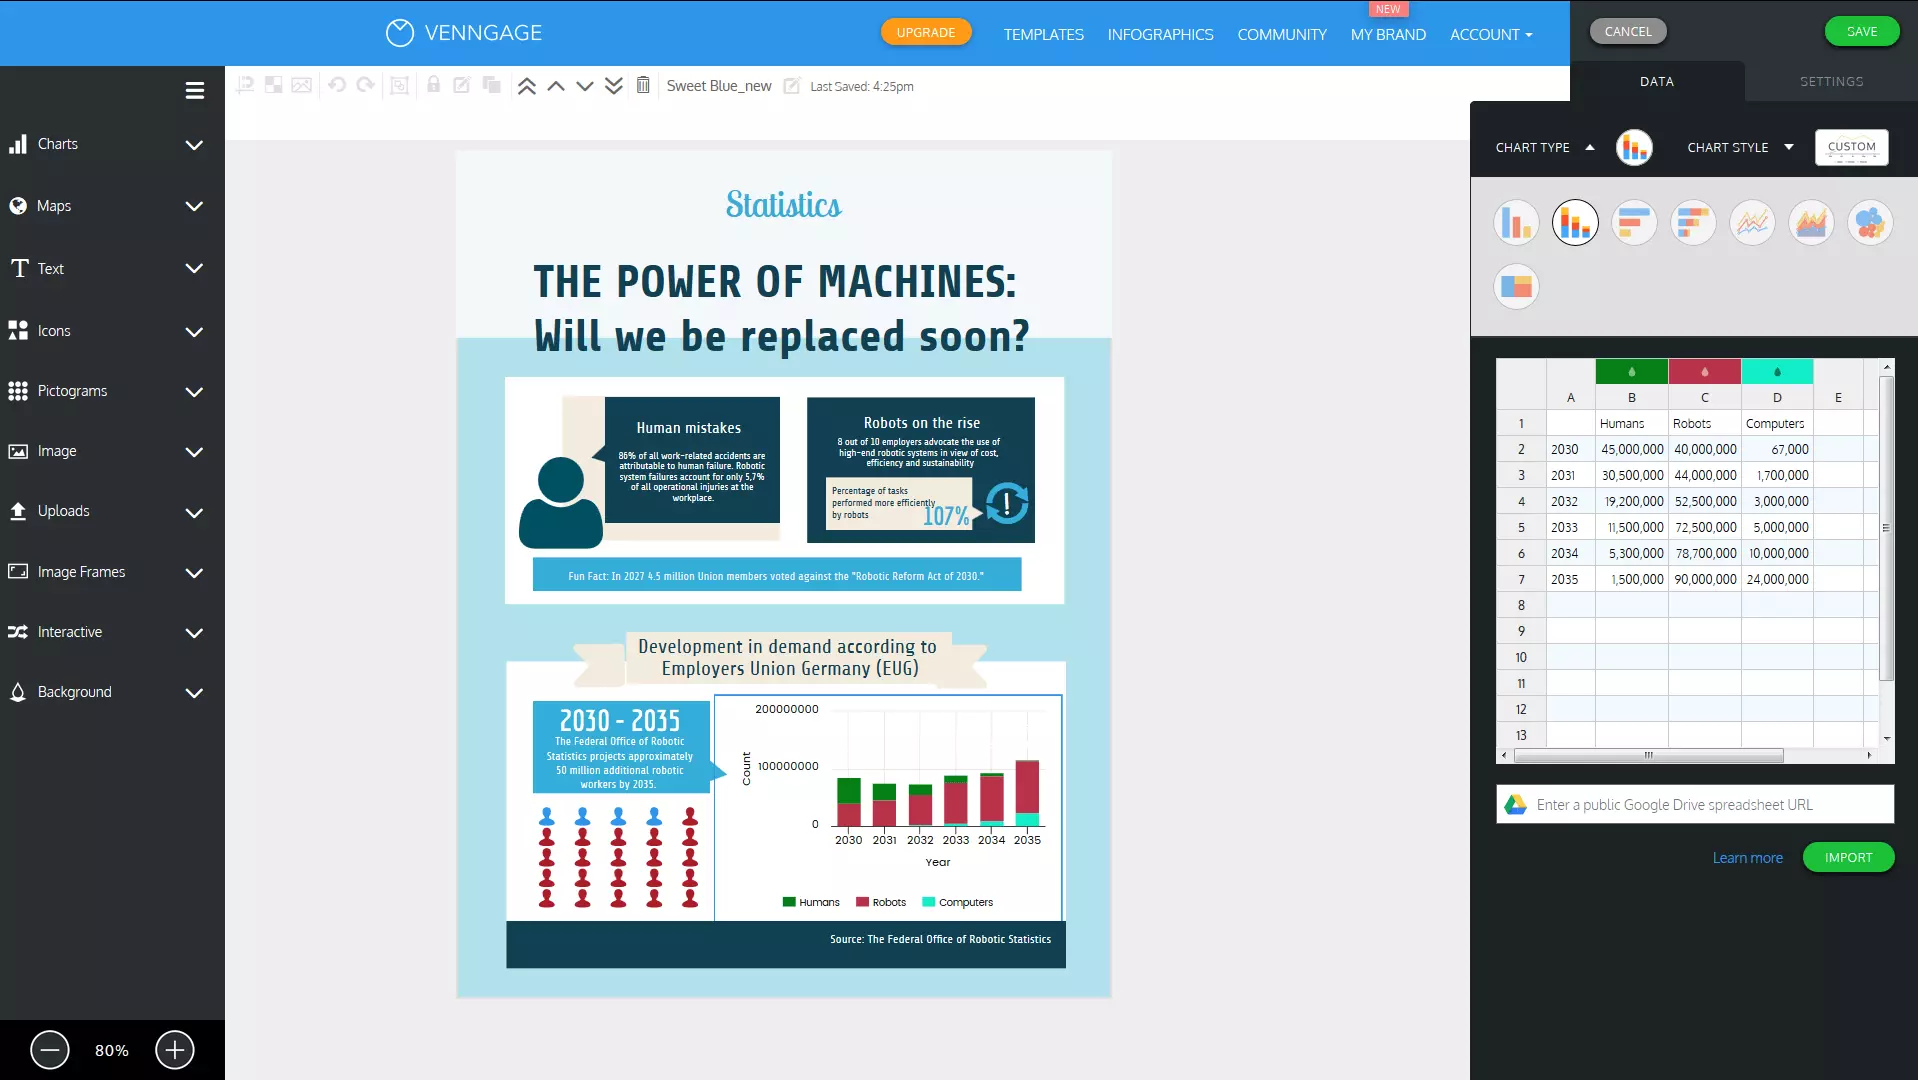
With the versatile Venngage infographic generator, you have several creative ways to make infographics. The tool includes a variety of designs for infographics and original templates for various purposes for students in the free version: for surveys, posters, brochures, advertising campaigns, and social media content. This makes it ideal for creative and web-based users who want to make data maps visually appealing. You have to search for free elements in the free package, but thanks to the clear user interface, you can create attractive graphics in a very short time and supplement them with your own media (e.g. by embedding YouTube videos). Unlike infogr.am and easel.ly, Venngage enables you to use the tool to import data sets from tables via Google Drive, and to easily arrange and edit individual color, text, and picture elements using the drag & drop feature. The result can be shared directly though the Venngage Community URL or on social networks like Facebook, Pinterest, Twitter, and LinkedIn. Anyone who wants to use even more of the program’s features can upgrade their account accordingly. This enables access to even more templates, design them yourself, use customer support, export and save your projects as high-resolution PNG files, export and save interactive or vector PDFs, and give others access to the files. Verdict: Venngage is an ideal free tool for creative users, who want to make their own graphics and process data and numbers.
Canva: create comprehensive infographics
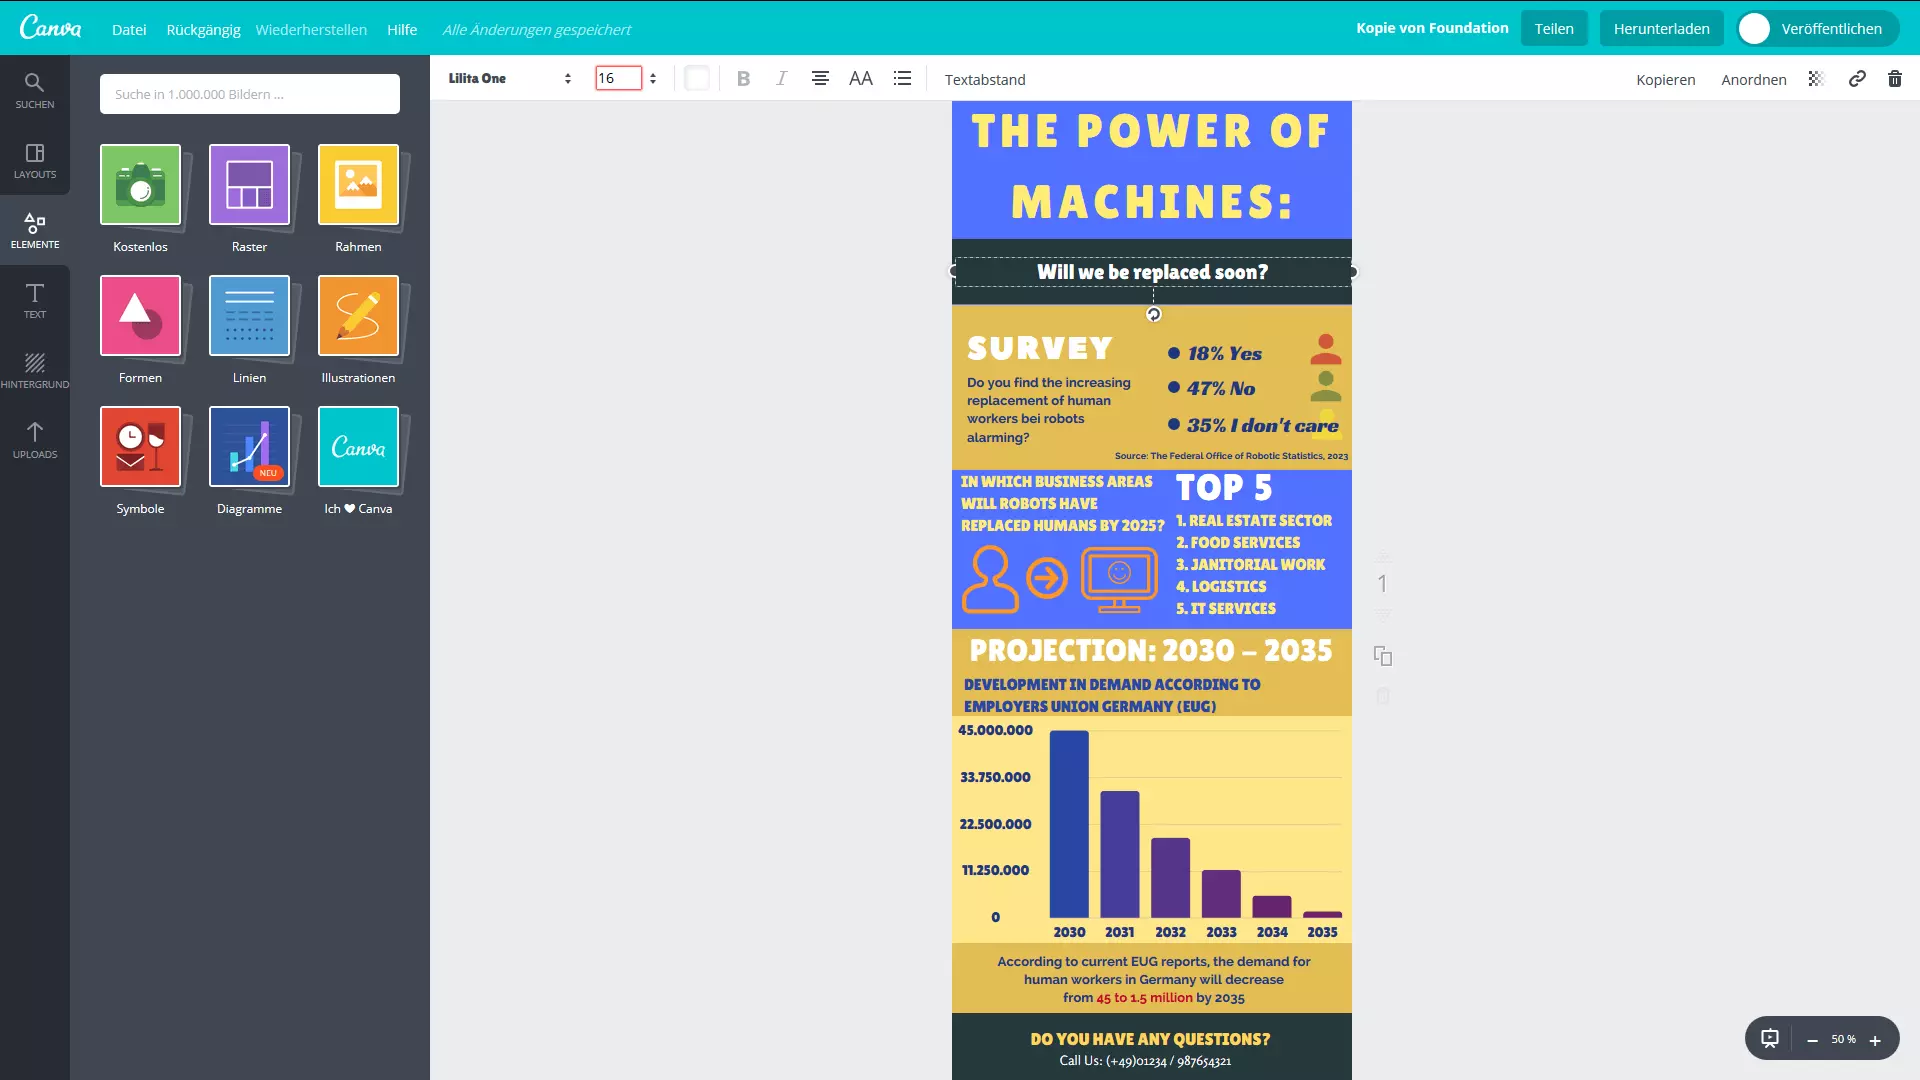
The graphic design tool, Canva has a versatile user interface. Although its aim was to be visually appealing rather than to process data, its huge selection of attractive and practical templates is impressive – suitable for projects like social media entries, office documents, (to-do lists, letter templates, etc.), blogging, e-mails, events, and advertisements. Infographics (resolution: 800 x 2000px) can be easily created with the drag & drop feature. The big advantage: all main functions of the tool are free – additional icons might come at a price. Canva is especially recommended for creative people. Color and symbols that you’ve used before are stored in the history and can quickly be retrieved. You can upload your own pictures and edit them with photo filter. The biggest advantage: Canva, unlike other free online tools, allows you to save your own projects as JPG, PNG, or (printable) PDF files. In addition, you can post your graphics directly to Facebook and Twitter or simply send them by e-mail. Verdict: if you are creative and won’t be put off by a wide range of features, you can use Canva’s extensive database and download option to create visibly stunning infographics.
Piktochart: make and save infographics with data sets
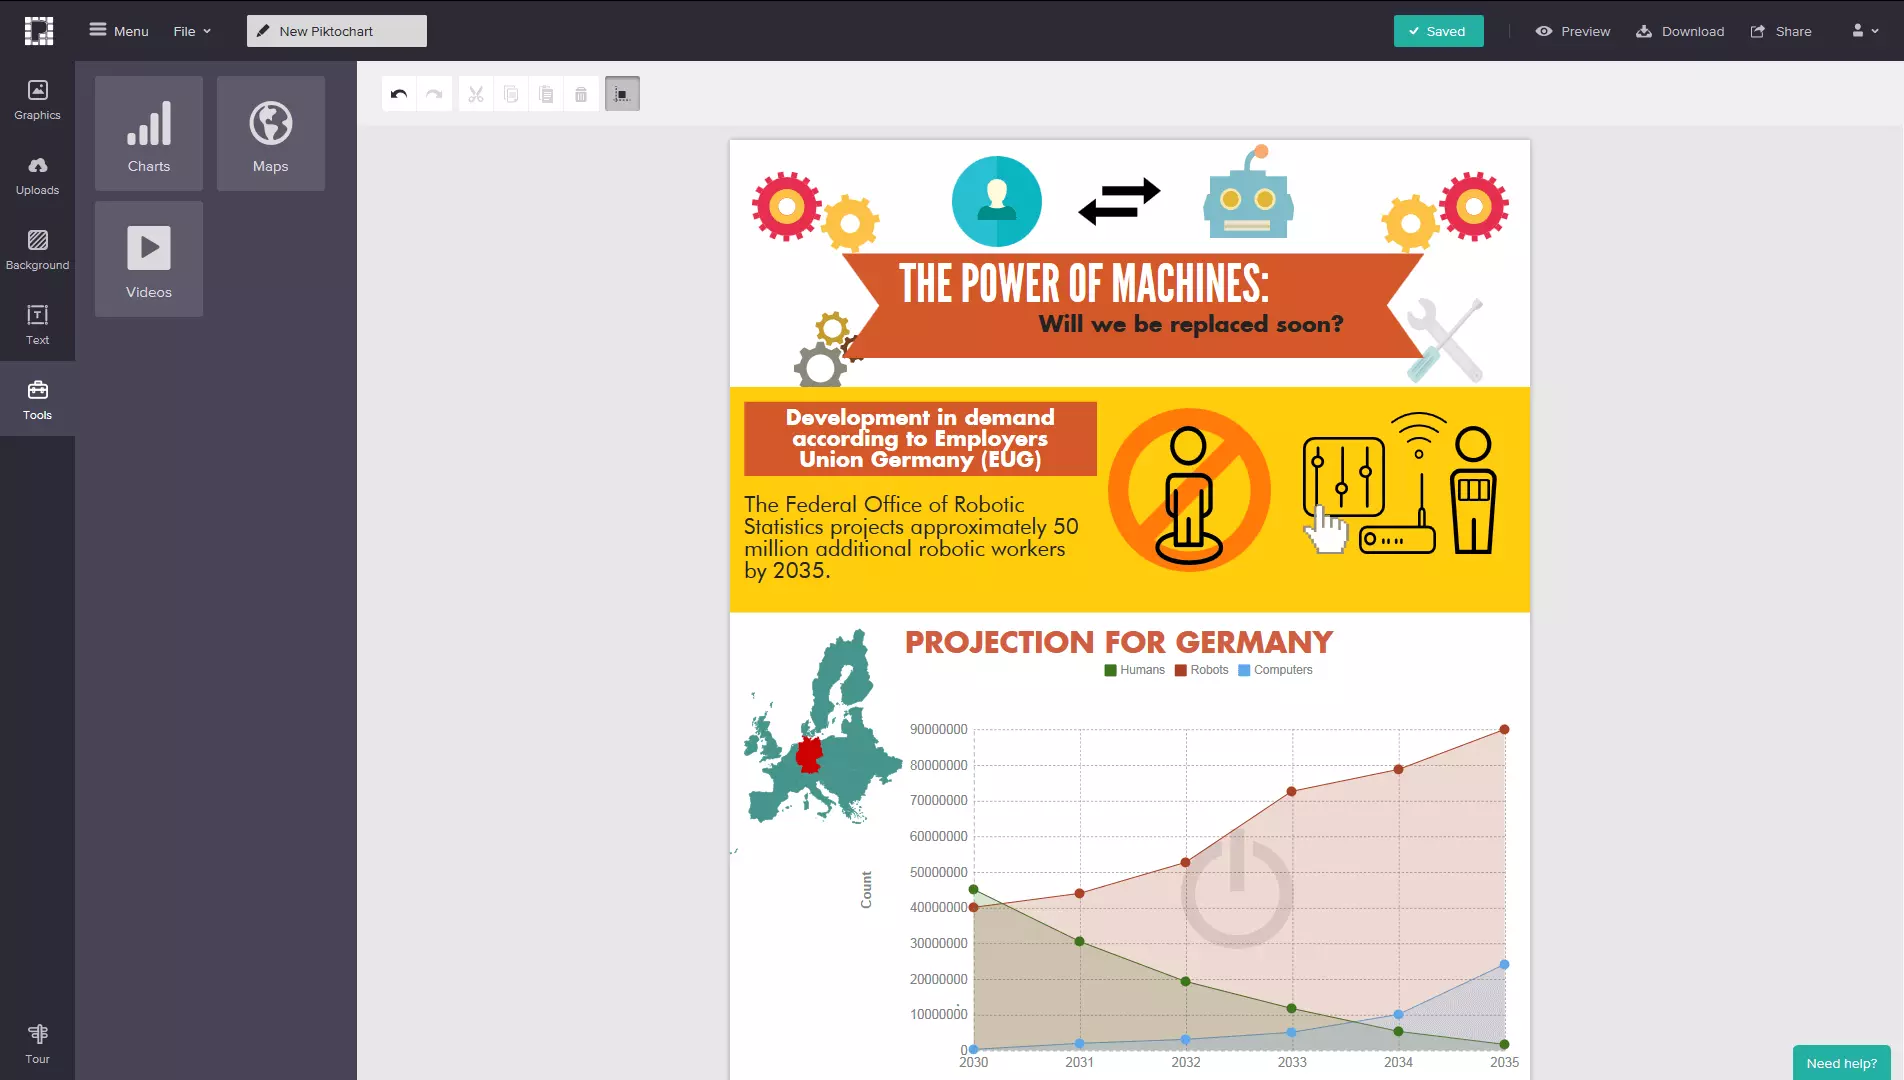
With the Piktochart visualization tool, you can not only create infographics, but also design presentations and print documents. What’s practical about this tool is that uploading your own photos and downloading and sharing graphics as JPG or PNG is included in the free account. Projects can be exported via Facebook, Twitter, Google, Pinterest, or be embedded in the Evernote planning tool using code. Table data can also be imported into Piktochart. If you would like to have a few additional options (like the advanced photo uploads, downloads in print quality, exports as PDF for SlideShare and LinkedIn, as well as password protection), you have to sign up for the paid subscription. Piktochart has two disadvantages: personal information is requested for free registration (name, company/school, age, and profession), and the Piktochart logo is visible on all projects created in the free version. Verdict: with Piktochart, you can easily design, save, and export your own infographics, although the logo on the finished product is a drawback.
Visme: create multifunctional infographics
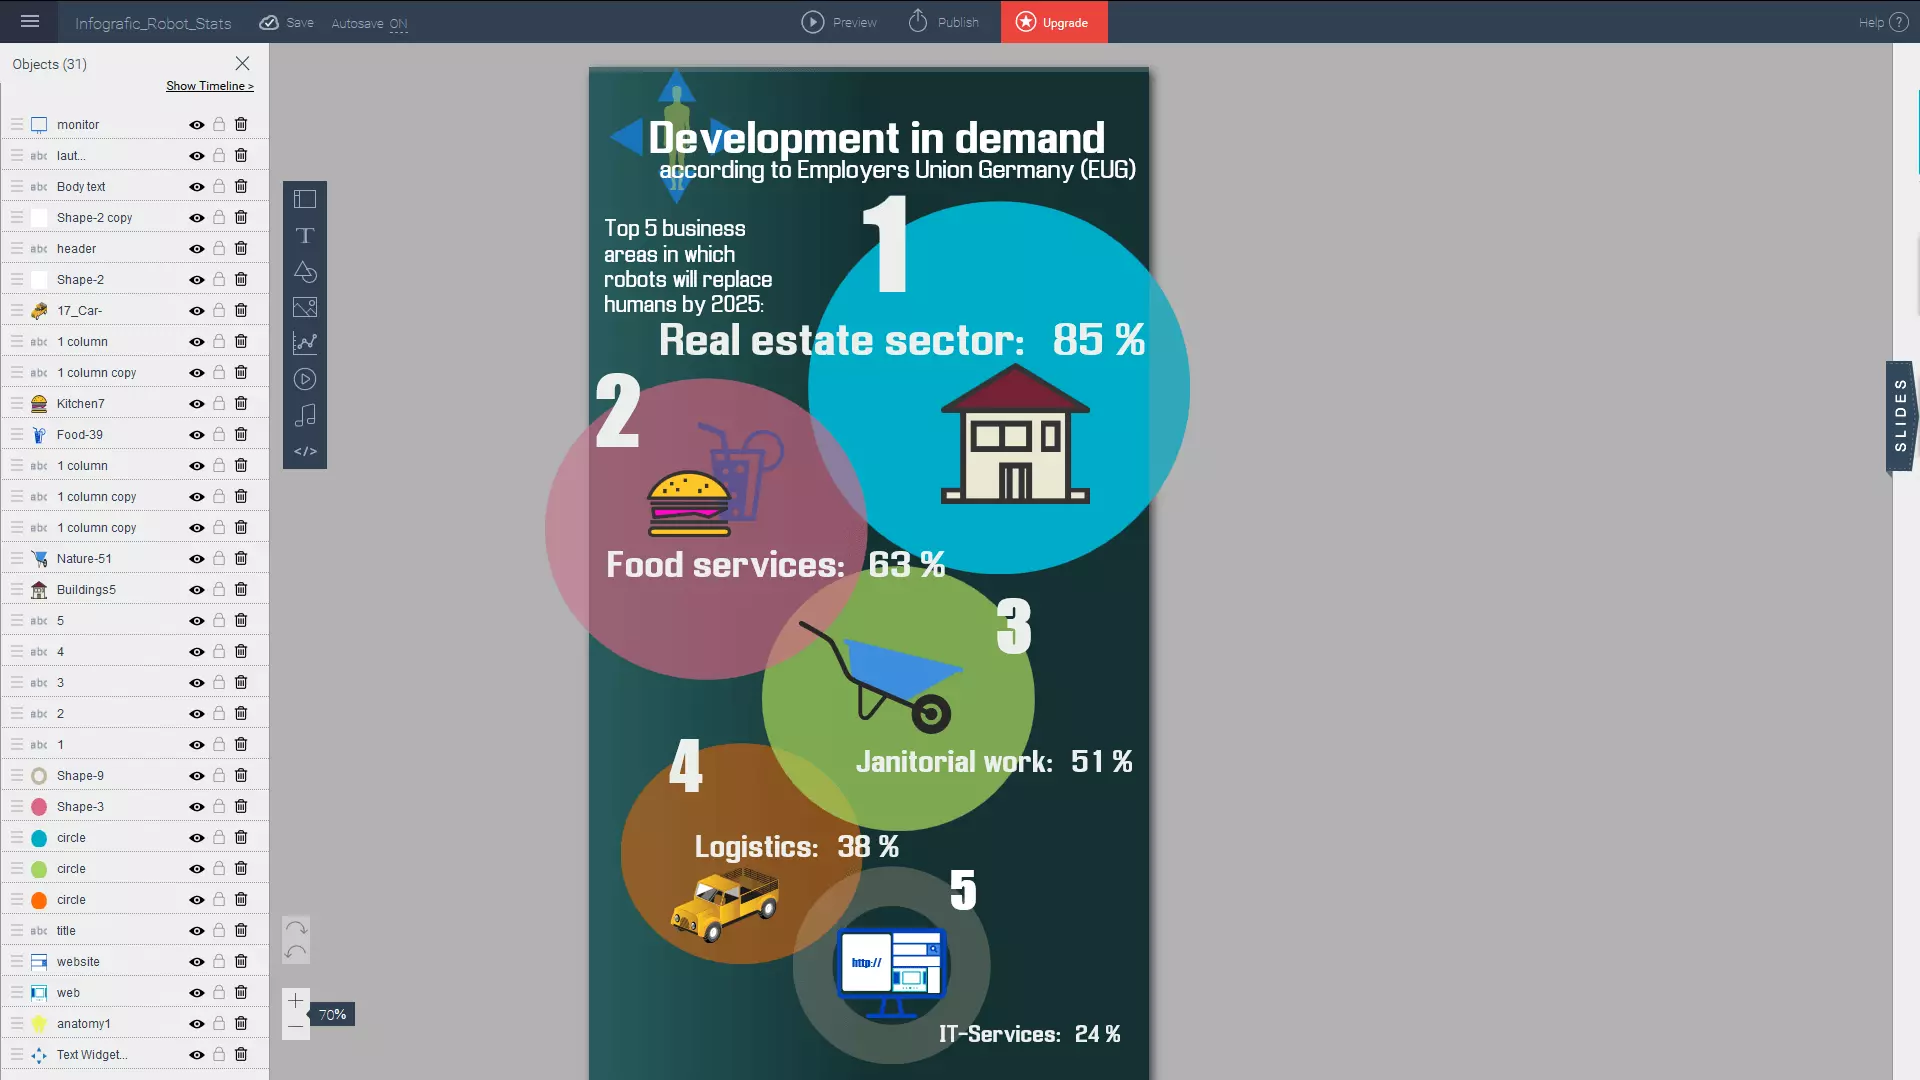
Visme is a multifunctional design tool that enables you to create infographics for free and export them in JPG format. Similar to common image-editing programs, the practical multi-level view allows individual access to certain elements (text, image, diagrams, symbols, etc.): by clicking, the user is shown on which level of the graphic the respective image element can be found. These elements can optionally be pushed into the foreground or background or made transparent. The practical autosave feature and the history of used image elements make work easier. Visme still has a few problems however: the drag & drop feature is practical, but quite cumbersome when selecting overlapping elements. Proportions are not displayed 100% correctly in the preview mode. Editing individual levels can be quite tricky for beginners. Verdict: with Visme you can create high-quality infographics – albeit with slight drawbacks when it comes to user-friendliness.
Summary
If you want to create infographics to enhance your presentations or the content on your own web presence, you don’t have to resort to expensive software or complicated image processing programs. There are many tools available online that are easy to use and enable you to create a variety of visualizations that can be processed, enriched, and shared over different media sources. If this isn’t enough, you can also subscribe to fee-based tools that offer ever more features. Creating infographics has never been easier.
The following is a brief overview of all the programs introduced above:
| Program | Free features | Premium features (selection) | Limitations |
|---|---|---|---|
| infogr.am | - Create, publish, save, and embed graphics - Import table data (.xls, .xslx, .csv) - Elements: texts, images, charts, maps, icons, videos - Autosave mode - Alternative registration via Google, Facebook, Twitter, and LinkedIn | Upgrade to pro, business or enterprise tariff (subscription): - Extended templates, more data volume - Export/download (PDF, PNG) for print - Extended maps, unlimited icons - Analytics features - Logo embedding - Linking cell data, table comparisons - Collective access - Commercial use allowed | - Not suitable for unusual designs |
| easel.ly | - Create, send (via link), save, and embed graphics - Customize template formats (e.g. photos, letters, A4, A3) - Elements: texts, images, icons, videos - Alternative registration via Google and Facebook | Upgrade to pro account (subscription): - 680,000 icons, more than 50 fonts and numerous templates - Customer support - Upload options (custom fonts and graphics) - Additional privacy settings - Export/downloads of high-resolution PDFs | - No import of CSV files - No separate chart function |
| Venngage | - Create, publish, and share graphics - Customize template formats (e.g. photos, letters, A4, A3) - Import table data via Google - Elements: texts, images, charts, maps, icons, videos - Embedding of YouTube videos possible - Alternative registration via Google and Facebook | Upgrade to premium or business (subscription): - Advanced templates, charts and icons - Export/download (interactive / high resolution / vector PDFs, PNG files) - Customer support - Branding for your own business - Team access | - Tedious search for free icons - Limited number of templates |
| Canva | - Create, publish, share, save, export (JPG, PNG, PDF) and embed graphics - Import image files (JPG, PNG, SVG) - Insert cell data (tables) manually - Elements: texts, images, grids, frames, charts, symbols, icons, videos, etc.) - Extensive database - Photo filter for easy image processing - Alternative registration via Google and Facebook | Free (surcharge for additional icons) | - Features require some familiarization - CSV file importing not possible |
| Piktochart | - Create, publish, share, save, export (JPG, PNG) and embed graphics - Import table data (.xls, .xslx, .csv) - Elements: texts, images, charts, icons, videos - Export in Evernote - Alternative registration via Google and Facebook | Upgrade to Lite, Pro, or Pro Team (subscription): - Extended and custom templates - Export/download without watermark (high resolution) - Password protection - Export in SlideShare and LinkedIn - Team access | - Requires personal information for registration (name, company/school, age, and profession) - Piktochart logo on projects |
| Visme | - Create, publish, save, and export (JPG) graphics - Elements: texts, images, charts, icons, videos (YouTube/Vimeo), audio files - Autosave mode | Upgrade to Standard or Complete subscription): - Extended templates - Create unlimited products - Export/download (JPG, PNG, PDF, HTML5) - Customer support - More data volume - Import from PowerPoint and Keynote - Folder organization - Team access | - CSV file importing not possible |


