Microsoft Visio: Free alternatives for creating diagrams and flow charts
The turn of the century saw Microsoft purchase the company Visio, and with it the software of the same name, for approximately 1.3 billion dollars. Having adapted it to their own concepts, they then proceeded to publish it as part of their Microsoft Office family under the name Microsoft Visio. Since then, newer versions of the tool have been released regularly, but never as part of the various Office Suites. Nowadays, Visio is available as part of the “Standard” and “Professional” editions of MS Office, and also as an additional purchase for Microsoft 365.
A quick glance at the scope and price of the program lets you know that the application is primarily designed for professional use in larger companies – something which also explains the relatively small circulation of the program. It is probable that an available budget is too low to fund the acquisition of this Microsoft software, or perhaps that the program is too complex for the intended purpose. If this is the case, then it is worth noting that cheaper, or indeed, free alternatives are available, and may be a better choice. Here, we compile a list of free Microsoft Visio alternatives and compare them to the Microsoft visualization program.
Dia
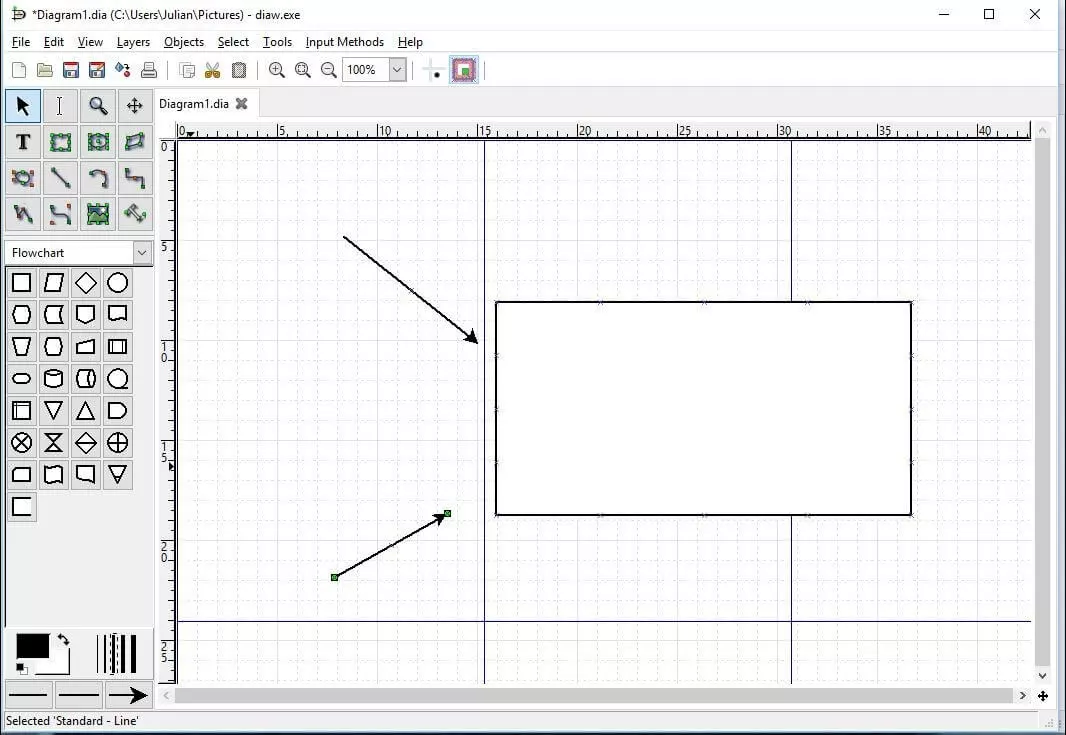
From the developers who brought us the GNOME Project, Dia is a visualization software primarily known through the GNOME Linux desktop environment of the same name. This alternative to Microsoft Visio is based on the GIMP Toolkit (GTK+) which is written in C – a free component library that offers diverse control elements for the design of user interfaces. As with most GNOME Project applications, Dia is subject to the GNU General Public License (GPLv2) and is available for use free of charge. Most Linux distributions contain the installation files for the program within the package management system, or alternatively, can also be found in the GNOME software selection. There are also versions available for macOS and Windows systems, which can be found in the download section of the official website.
Dia offers a standard set of general polygon and line objects, which can help you create diagrams and flowcharts for a wide range of industries; an administrator could compile an overview of a firm’s network, an engineer could outline structural systems, or a database specialist could even visualize an ER (Entity Relationship) model. Other specialist objects for the realization of your diagrams can also be found in the online shape repository. In order to make the process as easy as possible, the Microsoft Visio alternative also offers many options and shortcuts, which allow you to select, unselect, copy, and delete several shapes. This means you can work with a manageable drawing surface, which thanks to the coordination system, also enables the precise positioning of individual elements.
The standard format of the coordination system is the Dia XML Format (.dia). Additionally, many other formats are supported for exporting diagrams. These include:
- .eps (Encapsulated Postscript)
- .dxf (Drawing Interchange Format for Autocad)
- .png (Portable Network Graphics)
- .pdf (Portable Document Format via Cairo graphics library)
- .svg (Scalable Vector Graphics)
- .vdx (Visio XML Format)
Furthermore, you can also import graphics and pictures in different formats, like .bmp, .gif, .jpg or .svg and integrate them into your flowcharts and diagrams.
| Pros | Cons |
|---|---|
| Multi-platform compatibility | Lack of technical assistance (i.e. no extensive tool tips, etc.) |
| Numerous import and export formats | Outdated user interface |
| Supports Python scripting (once plug-in is installed) |
yEd Graph Editor
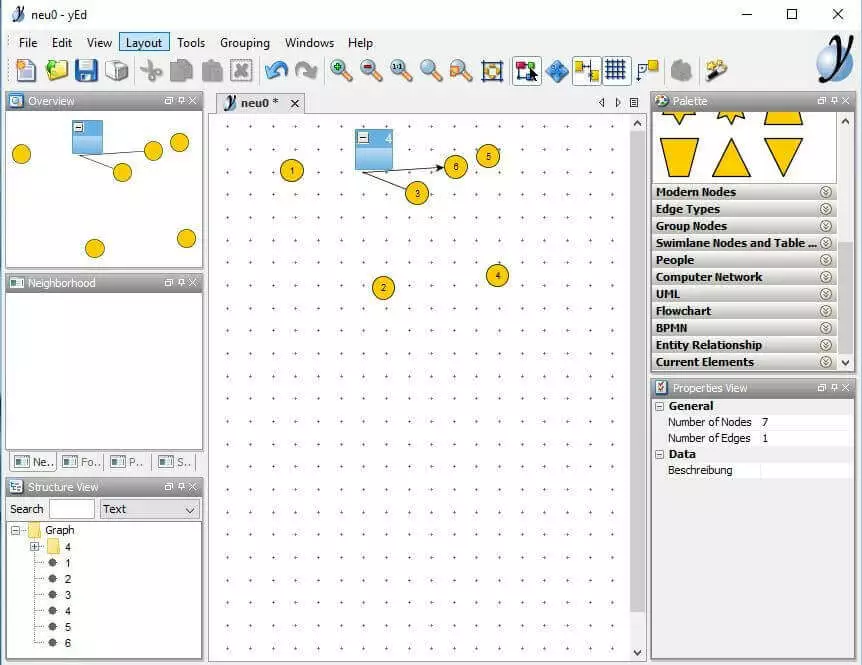
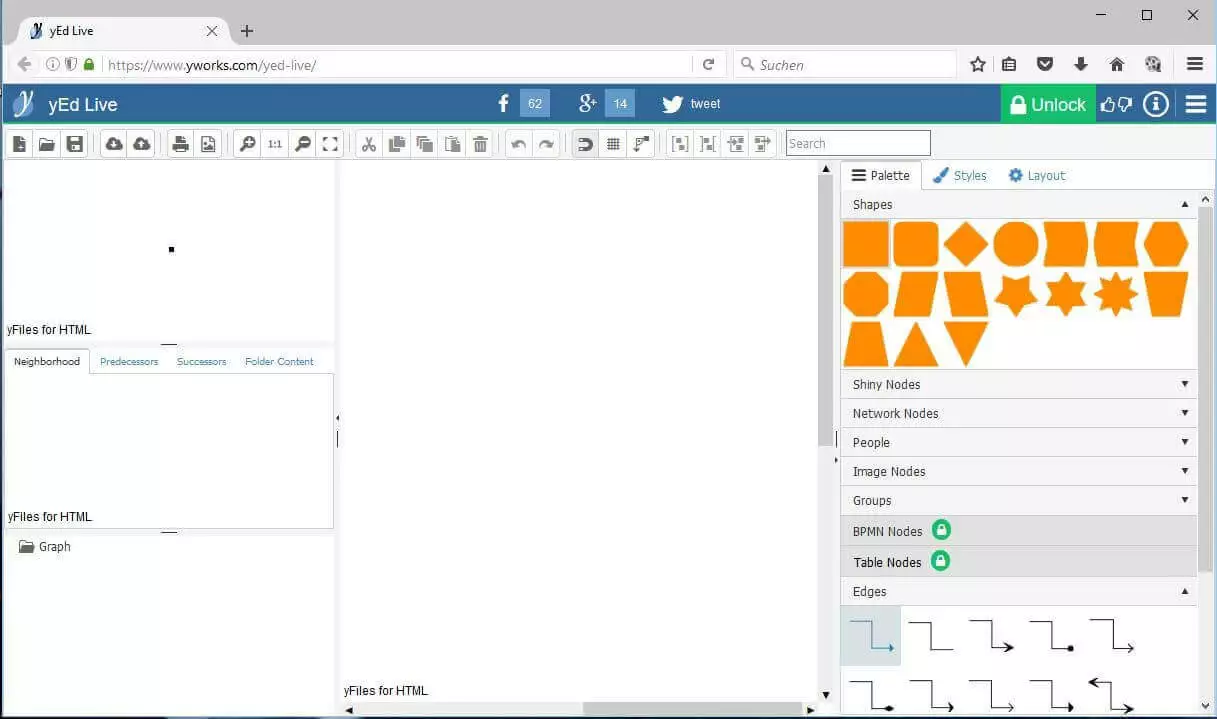
Created by the German software company yWorks, the yEd Graph Editor is undoubtedly one of the best free Microsoft Visio alternatives on the market. The visualization software is written in Java and is based on several Open Course components, such as the Batik SVG Toolkit and XML Beans from Apache, or various libraries like dom4j and TwelveMonkeys (both under BSD license). However, it is not published under a free license, meaning the source code cannot be changed. But yWorks has made the cross-platform editor, which is suitable for Windows, MacOS, Linux, and the Java Runtime Environment available for use free of charge. Alongside the desktop version, which can be found in the download section of the company’s official website, there is also an additional online version, which includes some fee-based “Pro Features.”
yEd provides numerous components for the creation of versatile and multifaceted diagrams. Alongside a large number of geometric nodes and link types, there is also a choice of UML (Unified Modeling Language) symbols for software-specific class and object diagrams, BPMN (Business Process Model and Notation) symbols for the depiction of business procedures, as well as several flowchart components. This alternative to Microsoft Visio has different functions, which will help you arrange and annotate the desired components of a diagram. Automatic layout algorithms, helpful guides, and orthogonal connections, all make positioning very simple. At the same time, the program’s inscriptions provide good readability. Below are some notable features of the yWorks editor:
- High-performance search and marking tools
- Undo and Redo functions
- Develop multiple diagrams at the same time
- Versatile and adaptable user interface
- Different viewing options (mouse wheel zooming, etc.)
- Automatic layout generation for complex volumes of data
- Import different sources of data, like excel tables(.xls), GEDCOM data, XML & GML files,
- Shortcuts for important functions
- Extensive preview area (general overview, object properties, object structure)
yEd Graph Editor offers six standard saving formats. These are the main format .graphml, the condensed version .graphmlz, the binary format .ygf, .gml (Graph Modeling Language) and .xgml (.gml with XML-based Syntax) as well as .tgf, the “Trivial Graph“ format. On top of this, there are also various output formats, like .html, .pdf, .jpg, .png or .gif, in which you can export your diagrams from this free Microsoft Visio alternative.
| Pros | Cons |
|---|---|
| Multi-platform compatibility | Difficult setup |
| Import function for complex data volumes incl. automatic processing | |
| Desktop and online versions available | |
| First-class hierarchical layout of individual objects |
Diagram Designer
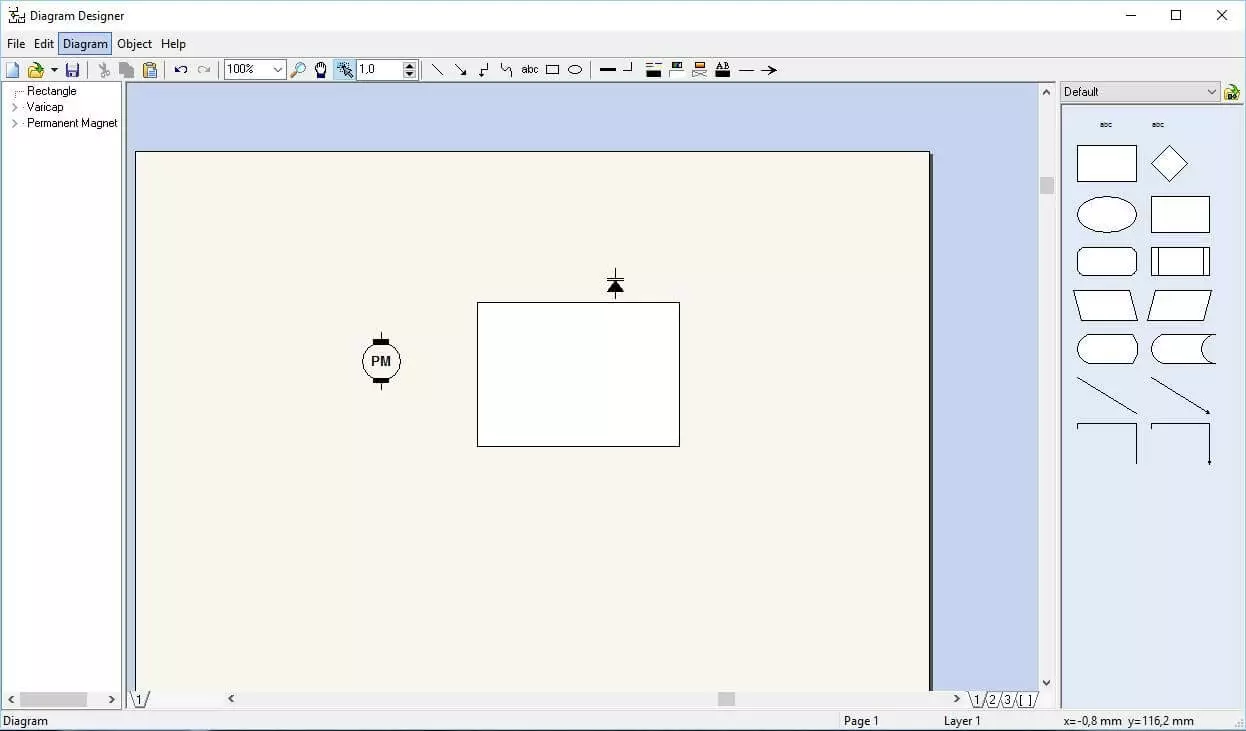
Another Microsoft Visio alternative, Diagram Designer, was released in 2003 by developers Michael Vinther and Mattes Dolak, and was published under the GNU General Public License on sourgeforce.net. Since then, Vinther and his company Meesoft are solely responsible for the software’s further development. Although no longer operating under a free license, the program is still available to use without charge. The source code of the most recent Open Source version of the software is available through the Sourceforge Repository. The newest version, along with packages in various languages, can be found on FossHub, where Diagram Designer has registered several hundred thousand downloads. Even if Diagram Designer’s user interface is not visually of the same standard as Visio, when it comes to creating diagrams, this freeware program can certainly be viewed as a viable alternative to its Microsoft counterpart. Particularly impressive is the choice of flowchart and UML components, as well as the range of technical symbols. The available object templates are widely adaptable, while also being connectable with the help of arrows and lines. In addition, there are several packages with finished object templates; all of which are available for download from the official website. The program allows you to build comprehensive flow charts, schematically represent work and production processes, or even visualize your design ideas. Here you’ll see some of the most important functions the software has to offer:
- Spell check
- Function graph plotter
- Easy shading options
- Work on several objects at the same time
Diagram Designer allows you to incorporate external graphics and images to enhance your diagram. As an alternative to Microsoft Visio it supports the formats .bmp, .jpg, .png, .gif and .pcx (Picture Exchange) and more. The default saving function, however, is the less widely used .ddd. Diagrams can be exported as an image file (.jpg, .gif, .png, .bmp, .mng, .pcx), as an icon (.ico), cursor (.cur) or as a metafile(.emf, .wmf).
| Pros | Cons |
|---|---|
| Different object templates available to download | Only available for Windows users |
| Spell check | Lack of import/export formats |
| Function plotter | No grid or coordinate system |
Apache OpenOffice Draw
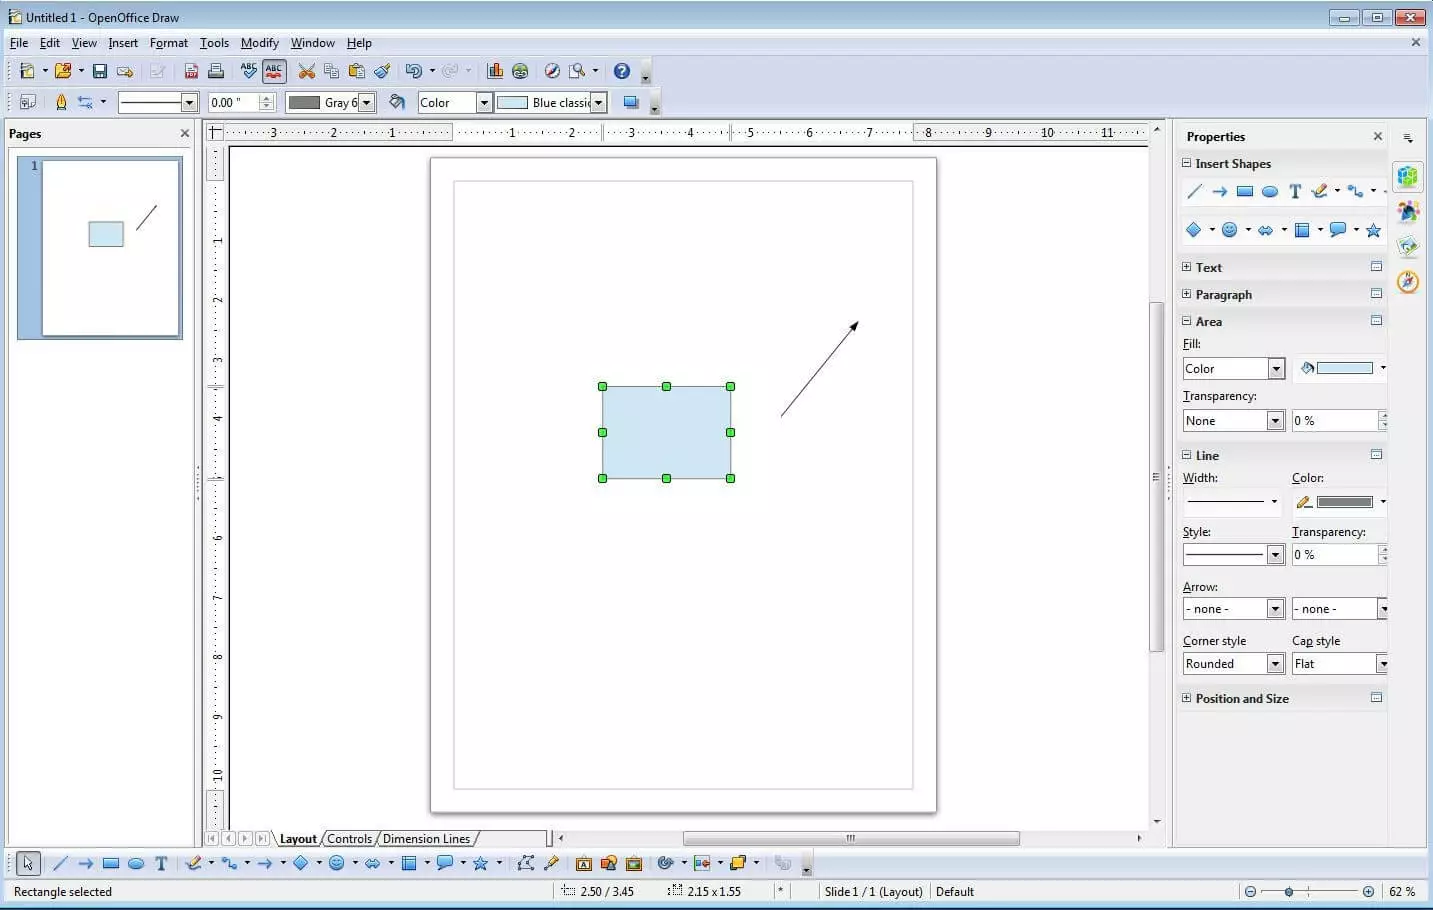
Apache OpenOffice (previously OpenOffice.org), with its text processing applications, spreadsheet assembly, high-quality presentation option, and the addition of the drawing program Draw, is a viable and free office alternative to Microsoft Visio. Since 2012, the software package has been further developed through the Apache Software Foundation, meaning the most recent versions are valid under the Apache License Version 2.0 (ALv2). Like all Office Suite programs, Draw is written in C++ and compatible across all platforms. In addition to the official versions for Windows, macOS and Linux, there are also other versions from third-party providers which have enabled use on further platforms, e.g. Android. An overview of all available installation files can be found on the website’s download section. Draw boasts a large range of functions as a free alternative to Microsoft Visio. Primarily the application serves to produce vector graphics from geometric components. Equally, it can also be used to edit pixel graphics, or to generate complex flow and organization charts. The relationship between various objects can be illustrated with the aid of specialist lines, also known as connectors, as well as glue points. Given that Draw is a set part of the office package, tables diagrams or formulae, which may have been compiled by other components like Calc or Math, can easily be integrated into the software. Likewise, components from Draw can just as easily be implemented into Open Office documents of different types. Some of the most important features of OpenOffice Draw are:
- Layer Management for the outlining of hierarchical and organizational threads
- Magnetic grid point system and rulers allowing for pinpoint positioning of individual elements
- Customizable and extendable toolbar
- Variety of geometric shapes (standard shapes, symbols, block arrows, flow chart tools, legends, stars and banners)
- Rendering of three-dimensional drawing objects according to the Flat, Phong, or Gouraud methods
- Uses cubic Bézier curves
The default saving process in Apache OpenOffice Draw is as in OpenDocument Graphic (.odg). Alternatively, you can choose the OpenOffice.org formats .sxd and .std, as well as the OpenDocument Format .otg. There are many ways for you to export your work; this particular alternative to Microsoft Visio supports exports in the form of HTML documents, PDF files, or as a flash application. Additionally, it is also possible to publish your newly-generated diagram as an image file (.bmp, .svg, .gif, .jpg, and many more), while you can also import graphics and images in various formats and later integrate them into individual projects.
| Pros | Cons |
|---|---|
| Multi-platform compatibility | Slow development/progression over last few years (LibreOffice split-off) |
| Large choice of import/export formats | |
| Office Suite Integration | |
| Good choice of customizable diagram components |
Google Drawings
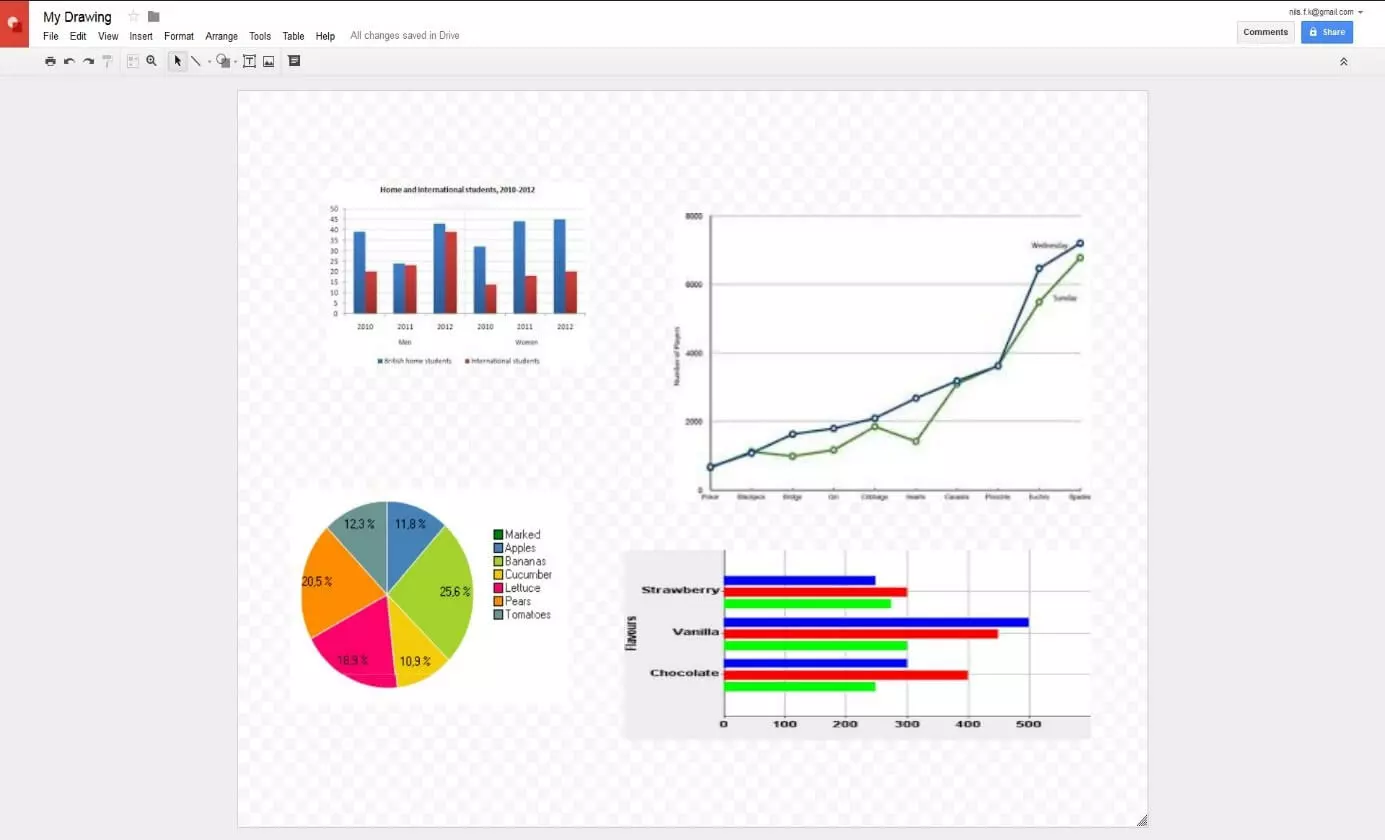
Google’s free online service Office Suite is not just made up of the well-known Google Docs (application for communal word processing), Google Spreadsheets (communal spreadsheets), Google Calendar, and e-mail service Gmail, but also includes the visualization software Google Drawings. As with all of these Google programs, you must first log in to be able to access the software. Available over a classic Google web frontend, this Microsoft Visio alternative will automatically save your projects in Google Drive – as it does with all docs, tables, or calendar entries. This means it requires a working internet connection and browser. On Android and iOS mobile devices, the program can be accessed through the Google Drive app, downloadable from the Google Play and App Stores. Google chrome also features a plug-in, which makes it possible to work with the tool in an offline capacity. Alongside an extensive selection of shapes, arrows and symbols, Google Drawings also features curved and angled (“Elbow”) connectors; both of which will further aid your project. In addition, there are also four ready-made diagram templates; bar charts, histograms, pie charts, and line graphs. These can be accessed with one single click, and can also correlate data from Google Spreadsheets. Tables can be easily incorporated into your diagrams or flowcharts. Once the required amount of lines and columns has been specified, the drag-and-drop function makes it easy to transfer the table to the desired position. Other features offered by this online alternative to Microsoft Visio include:
- Spell-checker, including custom dictionary
- Integrated search tool for facts/images from Google Drive and internet
- Numerous simplified keyboard shortcuts
- Comment tool
- Range of special characters, symbols, and icons available for text fields
- Edits visible for all users
Presenting and showcasing your work on Google Drawings is simple. Personalized invitation links can be sent via e-mail or can be shared on social media. In this regard, it is also possible to outline and define the rights of access to your project, allowing you to share the work with others and get them involved with the task. Furthermore, this completely free alternative to Microsoft Visio gives you the option of creating a downloadable version of your project, in the formats .pdf, .jpg, .png and .svg. Flowcharts and diagrams (in these formats) can also be uploaded to Google Drive and subsequently edited in Google Drawings.
| Pros | Cons |
|---|---|
| User-friendly | Files stored in Google Drive |
| Numerous shapes, symbols and special icons | Internet connection required |
| Link with Google Spreadsheets | Lack of exporting options and business features |
Draw.io
Any discussion on the best alternatives to Microsoft Visio has to include Draw.io. Sharing many similarities with its Google counterpart, this web application is based on the free JavaScript library mxGraph. For this reason it was originally released in 2011 under the name “mxGraph online.” Maintained and developed by the JGraph company, the program is available under the free license GPL v3 on the Draw.io website. The application is supported on desktop, tablet, or smartphone, with the complete source code available to view on GitHub. As a fully client-side software, Draw.io can be used in offline mode with a free, downloadable desktop app available for use on Windows, macOS, Linux and Chrome OS.
Regarding the saving of their documents, Draw.io users have several options. Diagrams can be saved using the online cloud services Google Drive, OneDrive, and Dropbox, regardless of which device you are using. But saving locally onto a hard drive is only possible on the desktop version. To get you started quickly, this Microsoft Visio alternative offers numerous useful diagram templates from some of the following areas:
- Business
- Graphics
- Technology
- Flowcharts
- Maps
- Cloud
- Network
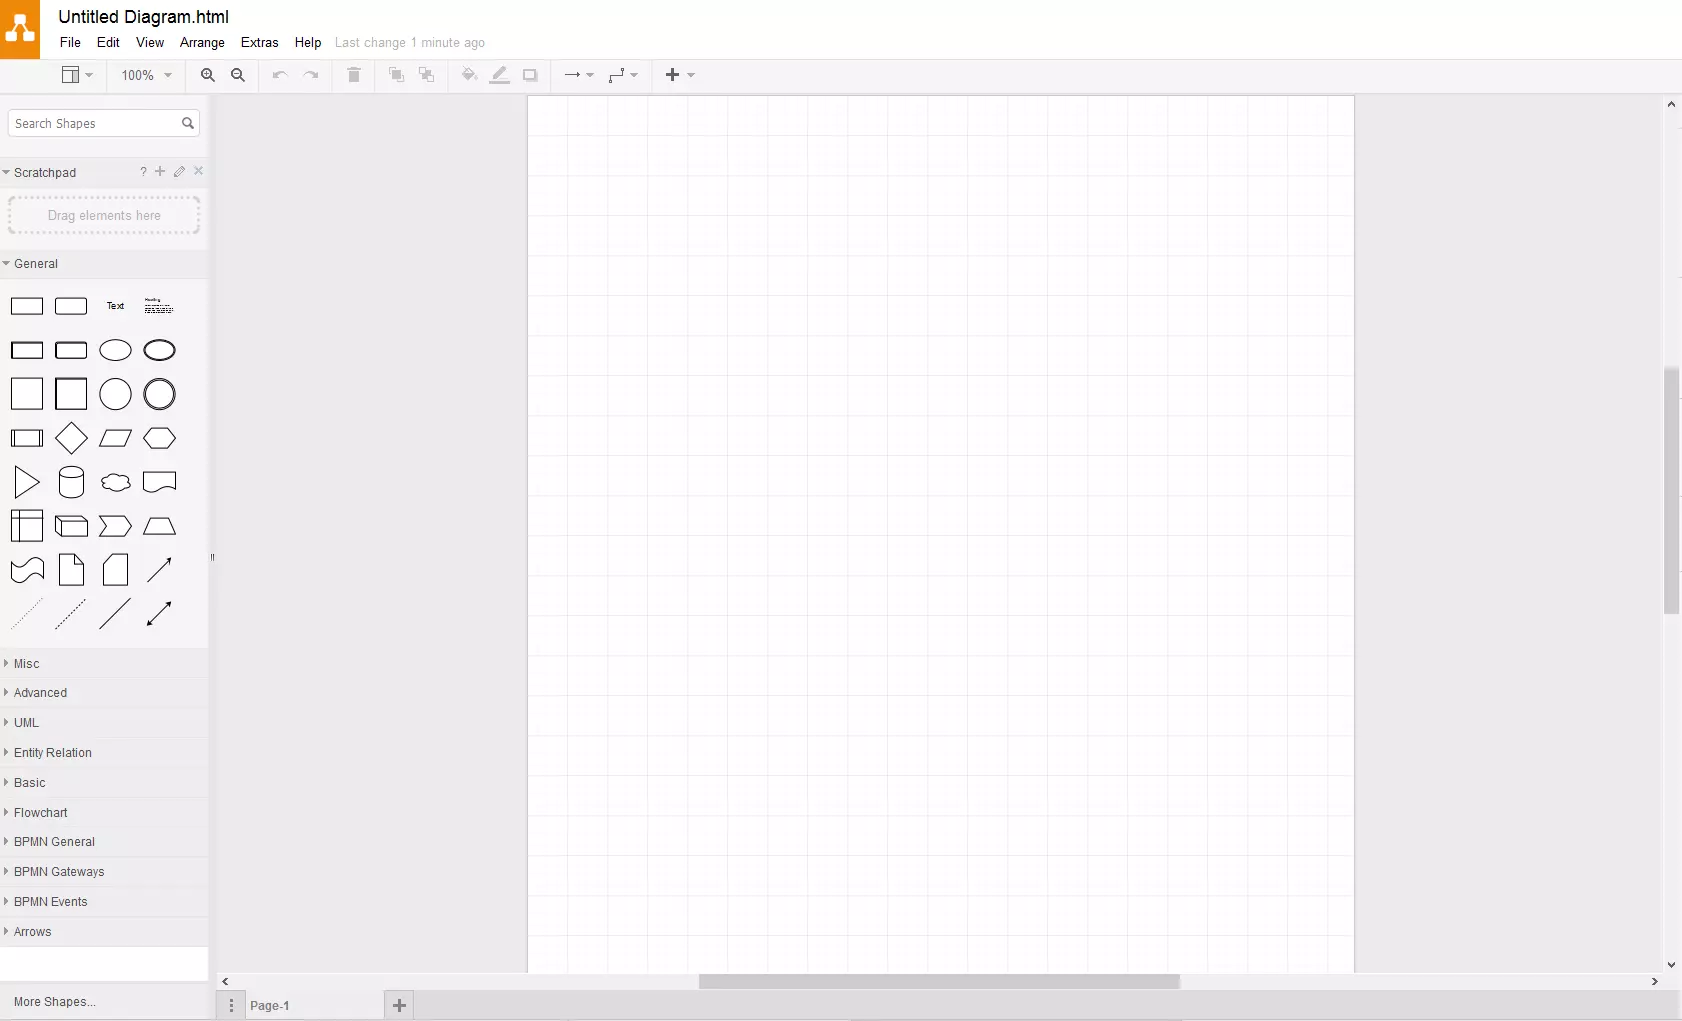
When it comes to actually designing diagrams, the program offers everything from basic geometric shapes to specialist UML, entity relation or BPMN (Business Process Model and Notation) diagrams – all of which can be added to the drawing surface with just the click of a button. The underlying grid and usefully embedded guidelines ensure truly effortless placement and positioning, while features like keyboard shortcuts, a project overview window, and the ability to create levels combine to ensure maximum user-friendliness.
As is to be expected from any alternative to Microsoft Visio, Draw.io features .drawio as the standard saving format for all diagrams and flowcharts. However, there is also the choice of formats like .jpeg, .xml and .png. Additionally .pdf is available as an export format, and publishing from the application onto social media is easy and convenient.
| Pros | Cons |
|---|---|
| Local storage possibility and offline mode for desktop users | Mobile device users reliant on internet connection and online storage services |
| First-class diagram templates for various sectors | |
| Commercial support for businesses available | |
| Large choice of symbols and icons (Microsoft Azure, iOS, Android, Bootstrap, and many more) |
Lucidchart
According to the developer Lucid Software, their program “Lucidchart” is used by more than 15 million users as an alternative to Microsoft Visio. The web application, which was released in 2008 and is written in a variety of coding languages including Java, Ruby, PHP and JavaScript, can be accessed directly through the official website. A prerequisite is having an individual user account, where you can choose between a free “Lite” edition and three paid subscription options. The latter three grant access to additional features like presentation mode, or extended storage space, and also removes the limits on documents and chart scope that exist in the free version.
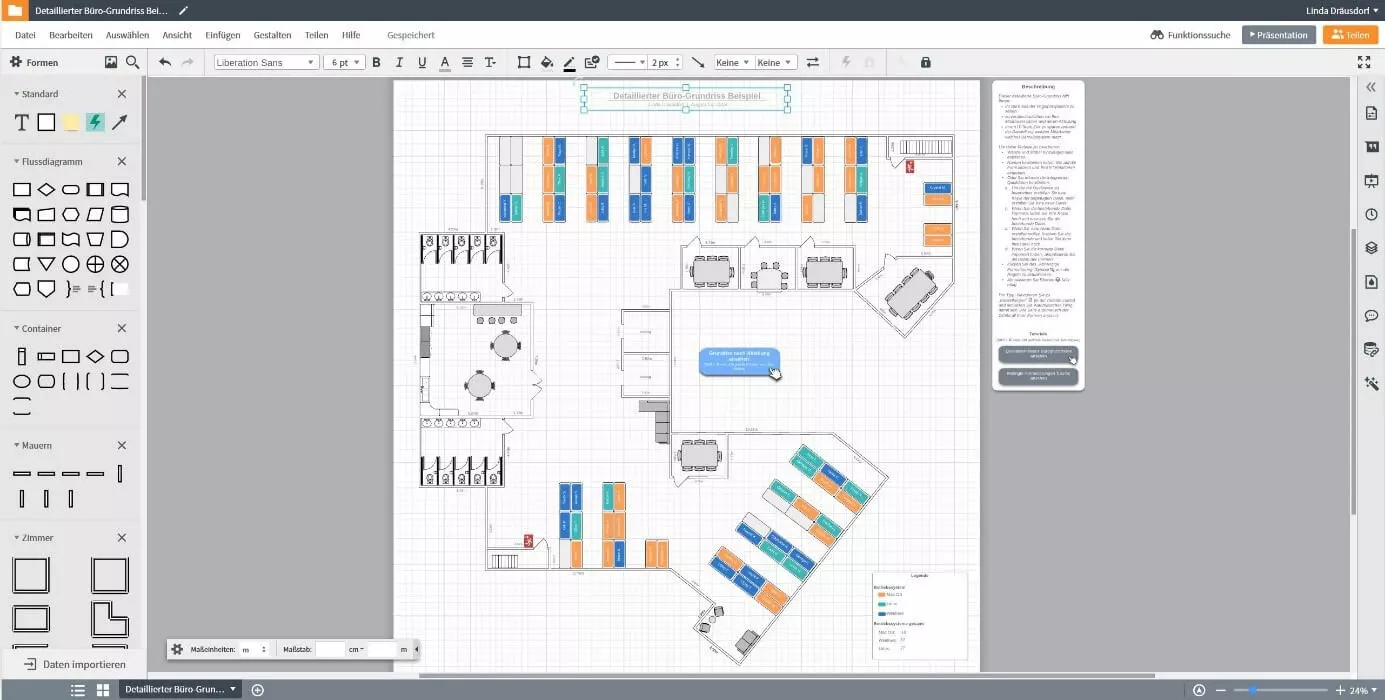
Lucidchart provides around 100 ready-to-use templates for creating and designing high-quality diagrams. The software covers categories like education, mind-maps, companies, floor plans or entity relationships (ER). Thanks to various icons, shapes and arrows, you can also create your own individual diagrams, which allow you to get access to special premium components if you are signed up to the “Pro” or “Team” plans, including importing and editing existing Visio projects. You also have the option to save finished projects to their servers, or download them directly to your device in the following formats:
- .png (Standard / with clear background)
- .jpeg
- .svg (Standard / with clear background)
- .vdx
- .csv
In addition to the download option, Lucidchart offers the option of sharing created diagrams with others. For example, documents can be published on social networks, embedded in any website through iFrame or forwarded through a link. The alternative to Microsoft Visio works seamlessly with typical Office and cloud applications like Microsoft 365, Google Workspace, GitHub, Slack or Amazon Web Services (AWS), which are installed plug-ins (“integrations”) that are only available to those using the paid “Teams” version.
| Advantages | Disadvantages |
| Offline Mode | Free basic version severely restricted |
| High quality chart templates for various industries | |
| Mobile apps available for iOS and Android |
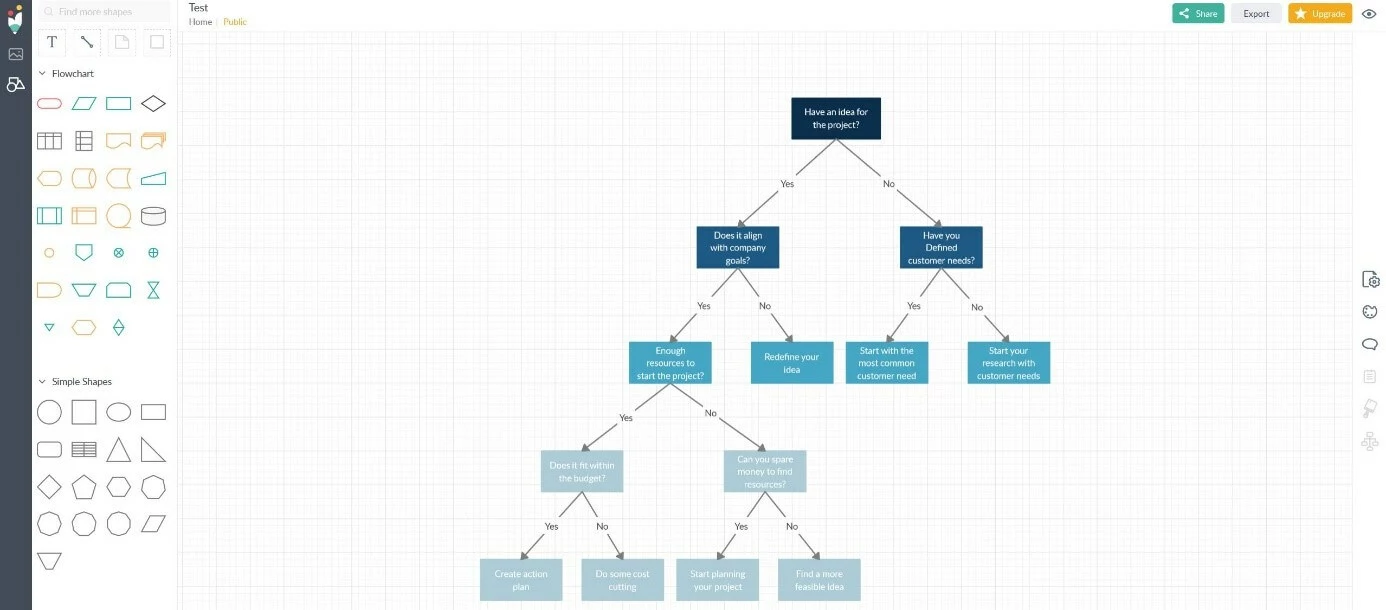
Creately
The 2009 Microsoft Visio alternative “Creately” was developed by Australian developer Cinergix. More than half a million users in more than 100 countries use the software, which is available as both a desktop and web app to create custom diagrams, either individually or as part of a team. However, the free version has limited function, with the entire range of Creately functions being reserved for users with an active monthly subscription (or those who purchase the desktop program). If you can work well with 5 documents, a single project folder and access for up to three people, then the free version could be a good free alternative to Microsoft Visio.
Creately shines with a huge selection of chart and flowchart templates. Around 1,000 professionally designed templates and millions of sample projects from the community are available to you – whether as a basis for or a source of inspiration – at any time, including the following categories:
- Business strategy and processes
- Product life cycle
- IT structures
- Design
- Sales and Marketing
- HR (Human Resources)
- Education
During the editing process, the software saves all your actions in real time on their servers, so your progress is not lost, even when the Internet connection is interrupted. If you want to use Creately as a free alternative to Microsoft Visio, your projects will be automatically publicly available – but only paying customers have the option to create private documents and share these only with who they want. There is a similar limitation when exporting completed diagrams and flowcharts: While PNG or JPEG formats are available in the free basic version, premium users with SVG export have a third option for high resolution graphics.
| Advantages | Disadvantages |
| Thousands of usable templates and user examples | All documents created with the free version are automatically made available publicly |
| Available as a web and desktop app (always paid) | Few export formats |
| The web app is only available in English |
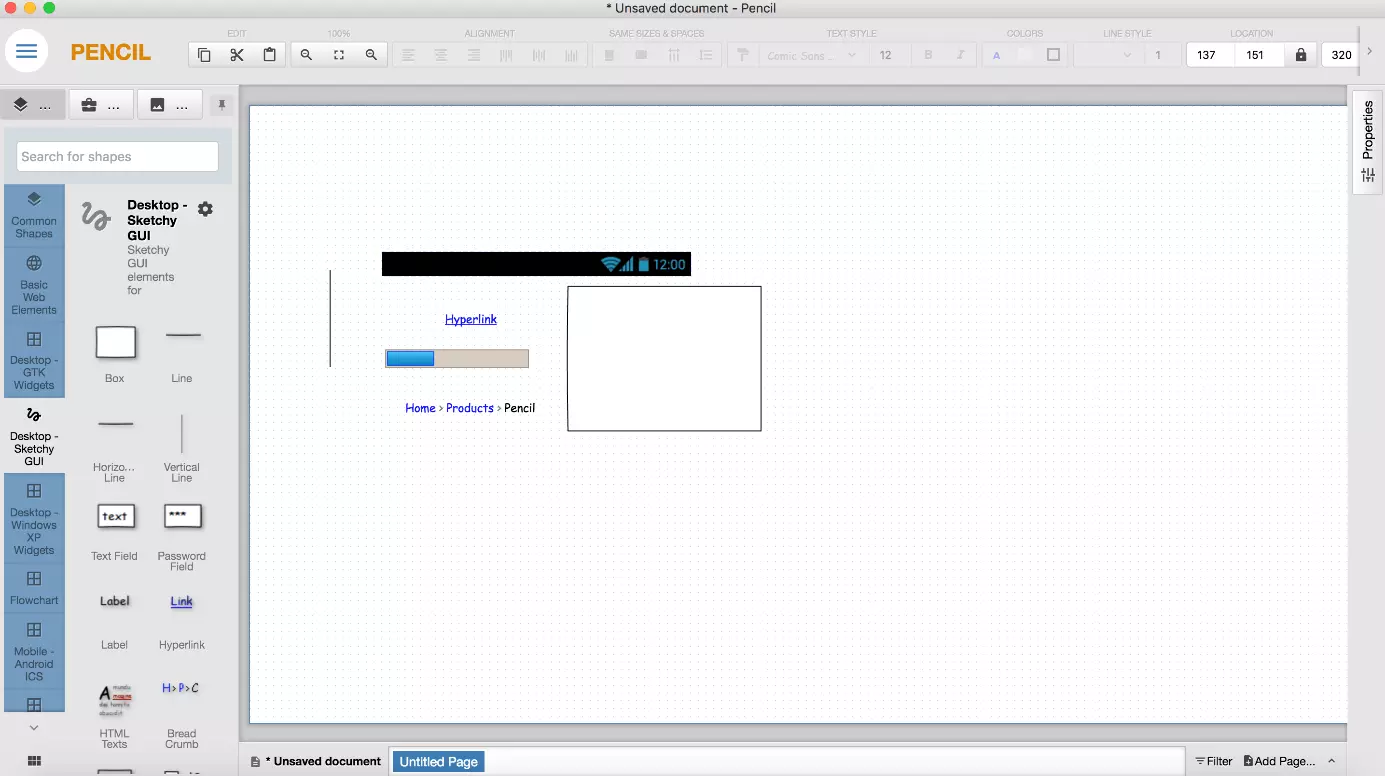
Pencil Project
The Vietnamese software company Evolus are launched Pencil Project in 2008, a visualization project based on the Mozilla Firefox web browser. Thanks to this format, the GPL-licensed Microsoft Visio alternative has long been installed and used as a simple Firefox extension. However, this is no longer the case with newer versions, which are now based on the open source framework Electron (formerly Atom Shell). The developer is still providing cross-platform editions for macOS, Windows or Linux (Ubuntu, Fedora) that can be downloaded free of charge through the official Pencil Projects website.
Pencil Project gives you access to various graphical elements, which can easily be moved with drag-and-drop so that the diagram, prototype or idea flow chart can be created as quickly as possible. In addition to the standard flowchart objects and geometric shapes, the available components include buttons and icons for desktop and web UI’s, as well as typical Android and iOS elements. You can also search for high-quality clipart graphics through an integrated OpenClipart.org interface and add them to your project. The alternative to Visio uses the in-house .epgz format to store files on the local hard drive. In addition, your project can be exported in the following formats:
- .png
- .html
- .svg
- .odt (OpenOffice document)
A special Pencil Project feature is being able to link items to a specific page in the same document. HTML export automatically converts these links to HTML hyperlinks, which allows them to be tested and presented in the live environment. This feature is particularly useful when you design website or app prototypes.
| Advantages | Disadvantages |
| Excellent for web mockups | English language user interface |
| Interface to large online clipart database | Usable objects are partially obsolete |
| Easy to use |
Comparison table of the 9 Microsoft Visio alternatives
| Dia | yEd Graph Editor | OpenOffice Draw | Diagram Designer | Google Drawings | |
|---|---|---|---|---|---|
| License | GNU GPL | proprietary | Apache v2 | proprietary | proprietary |
| Programming language | C | Java | C++ | Delphi | Web languages |
| Platform | Windows, Linux, macOS | Windows, Linux, macOS | Windows, Linux, macOS | Windows | Windows, Linux, macOS |
| Web-based | no | no* | no | no | yes |
| Local storage possibilities | yes | yes | yes | yes | no |
| Standard format | .dia | .graphml | .odg | .ddd | - |
*yEd live also offers a web version of the software
| Draw.io | Lucidchart | Creately | Pencil Project | |
|---|---|---|---|---|
| License | Apache v2 | proprietary | proprietary | GNU GPLv2 |
| Programming language | JavaScript | Multiple | Multiple | C++, JavaScript |
| Platform | Windows, Linux, macOS | Windows, Linux, macOS | Windows, Linux, macOS | Windows, Linux, macOS |
| Web-based | yes | yes | yes | no |
| Local storage possibilities | yes | yes | yes | yes |
| Standard format | .drawio | - | - | .epgz |


