Creating a flowchart in Excel is quick and easy
A flowchart is an excellent way of depicting processes in a clear diagram that everyone can understand at a glance. These diagrams are often used to show relationships between cause and effect, especially in everyday workflows. To present flowcharts, Word documents, PowerPoint presentations, and even Excel spreadsheets are among the most effective tools.
- Store, share, and edit data easily
- Backed up and highly secure
- Sync with all devices
What are flowcharts used for?
A flowchart is a diagram that depicts a chronological sequence. The diagram does this by showing the individual steps of a process. Most flowcharts follow a clear direction, allowing you to see how one step in a process flows into the next.
A flowchart is a diagram that represents the individual steps or phases of a process in a clearly defined sequence.
Flowcharts are used in a variety of scenarios. For example, program flowcharts are used in computer science to visualize the steps of an algorithm. In Excel, you can create both complex visualizations and more practical alternatives. For example, you can use a flowchart to visualize a project you’re planning with your team.
Flowcharts are also useful for analyzing processes. The graphic representation makes the process flow easier to understand and helps to identify errors or unnecessary steps.
Creating a flowchart in Excel
Creating a flowchart in Excel by inserting shapes
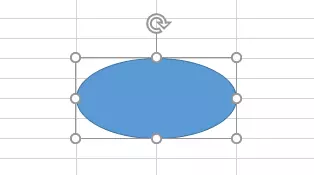
You can insert a variety of graphic objects into your Excel spreadsheet. These include circles and rectangles as well as arrows, which are essential to a flowchart. To insert a new shape into your worksheet, select it from the list, drag your mouse until the shape is the size you want it to be, and then release your mouse.
To align each symbol as accurately as possible, use a grid of rows and columns. Once you’ve created a shape, the “Format” tab will appear on the ribbon. This tab is primarily for customizing your graphic, but if you want to create a precise design, you can also use the lines of the Excel grid as guides. When you do this, the edges of your object snap to the lines of the cells. You can enable this feature by selecting “Align” and choosing “Snap to grid.”
You can also resize cells so that you can more easily insert the individual elements of the flowchart. To do this, select your entire worksheet (Ctrl + A) and right-click a row or column. You can then adjust the size in the context menu. You can then select “Snap to shape” from the drawing tools (also found in the “Align” section). The edges of the cells are then aligned with the inserted shapes.
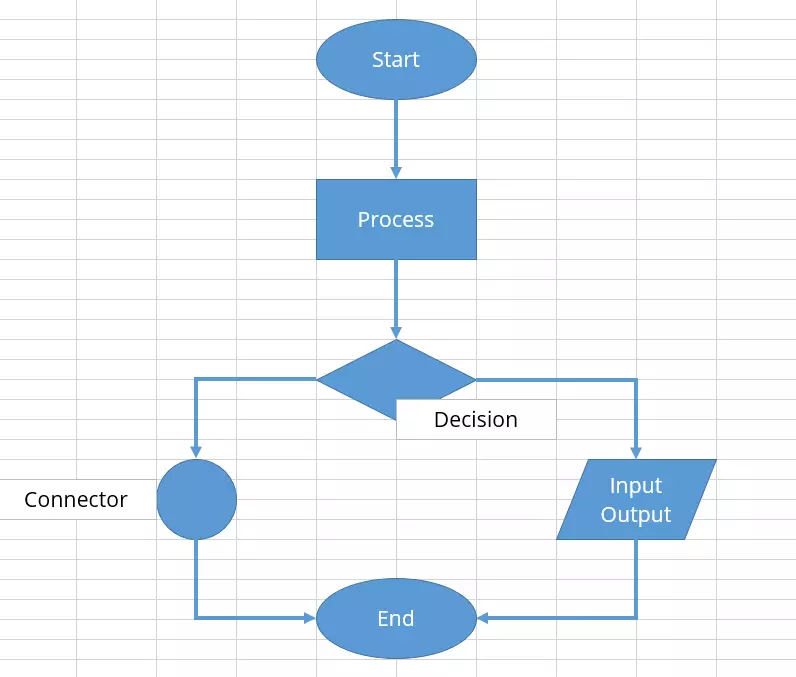
Although you’re free to choose your own shapes, certain symbols are commonly used for flowcharts. If you choose one of these standard symbols, many more people will immediately understand what your flowchart is trying to convey.
- Oval: Start
- Rectangle: Process
- Diamond: Decision
- Circle: Connection
- Parallelogram: Input/output
Excel offers a group of standard flowchart symbols for you to choose from.
You can use drawing tools to customize the appearance of the objects. For example, you can change the color, fill or thickness of the outline. You can apply further visual effects using “Shape effects” to add shading or soft edges. If you want to add multiple objects of the same type to your flowchart, you should use copy and paste. This will ensure that the symbols all have the same look and identical dimensions.
Use lines or arrows to connect the individual symbols. When you add lines, you’ll notice that there are points connecting to the shapes you created earlier. You can snap the beginning and end of the lines and arrows to these connection points. That way, you don’t have to worry about making perfect connections on your own.
Finally, your flowchart will need different labels. You can use text boxes for this, which you can create via the “Insert” tab. Alternatively, you can label the object directly, but then you won’t have an extra element. Here too, you can use the drawing tools to customize the appearance of the box. You can also use the standard text formatting options.
Using SmartArt
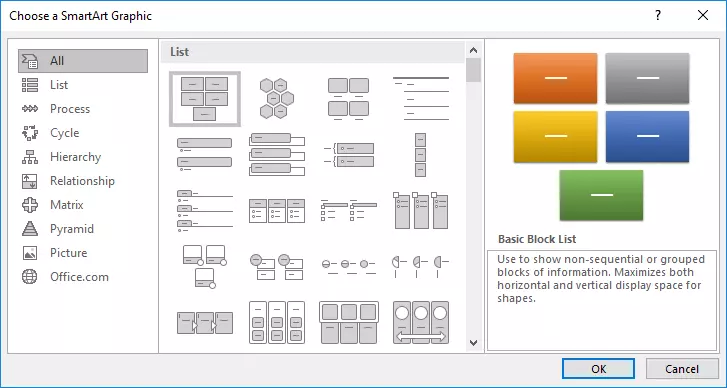
The “SmartArt” feature in Excel helps you to create sophisticated graphics more quickly by providing a variety of layouts to choose from. For example, you can use this graphics wizard to create lists, organizational charts, or even process flow diagrams. The tool provides a little information for each layout. This can be helpful if you don’t know exactly which option to choose. Keep in mind, however, that the preview doesn’t have to match the finished flowchart. You can still customize many parts of the layout after you’ve created it.
The SmartArt tool is available in Excel, Word, and PowerPoint and has the same functionality throughout Office.
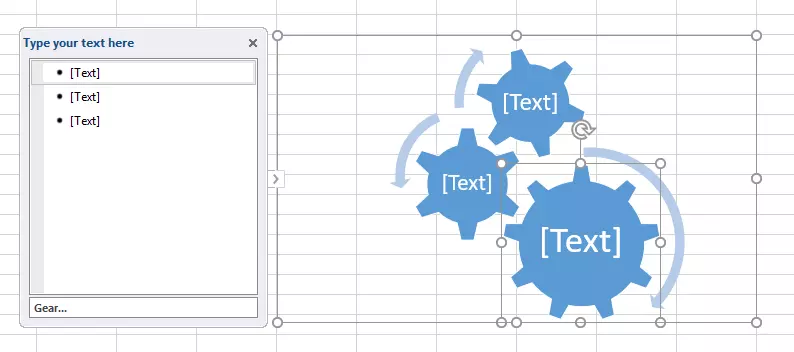
Once you’ve chosen a layout, click “OK” to confirm your selection. You’ll see that Excel has already created text boxes for you. You can fill in the text using the helpful text box, which you can open or close this box by clicking the arrow on the left side of the graphic. You can use the box to add text to your chart or insert new elements by creating a new bullet point.
Alternatively, you can use the “Add shape” function on the “Design” tab in the SmartArt tools section of the ribbon. You can use this function to specify whether to insert the new element before or after the element you just selected.
You can also use SmartArt to customize the look of the flowchart, not just its contents. For example, you can change colors or apply other visual effects (or by right-clicking the graphic).
- Store, share, and edit data easily
- Backed up and highly secure
- Sync with all devices


